The 50 Largest Employee Benefits Insurers in the US
Contents
Ranked by premium, from every 2024 employer benefit filing that includes an insured contract
US employers have to report each insured benefit contract, the insurer behind it and what they paid for it. We read every 2024 filing and built the list below from them. 820 insurers show up, across $185.5bn of premium.
This list is one of a pair. The other ranks the firms that advise employers and place this cover, in the 100 largest employee benefits brokers for medium and large US employers. Both come out of our wider study of what benefits big US employers actually offer, which breaks the same filings down by industry, by state and by plan size.
1. What this list measures
Insurers are ranked by the total premium employers paid them in 2024. Premium is a better guide to size than headcount, because a life or dental policy can cover a whole workforce for very little, while health cover costs far more per person. Ranking by headcount would push the firms that sell the smaller benefits above the health insurers that hold most of the money.
The people column counts covered-person records across contracts. Somebody covered for health, dental and life shows up three times. Read it as reach, not as a headcount.
2. The 50 largest insurers by premium
Kaiser Foundation Health Plan comes first with $36.3bn of premium from 14,082 employers.
| # | Insurer | Premium | Commission | Rate | Employers | People covered |
|---|---|---|---|---|---|---|
| 1 | Kaiser Foundation Health Plan | $36.3bn | $482.9m | 1.33% | 14,082 | 20,730,809 |
| 2 | Blue Cross Blue Shield | $21.6bn | $458.6m | 2.12% | 9,394 | 6,920,062 |
| 3 | UnitedHealthcare | $18.3bn | $353.1m | 1.93% | 8,702 | 12,456,791 |
| 4 | Cigna | $13.2bn | $307.5m | 2.32% | 8,159 | 8,264,307 |
| 5 | Aetna | $13.0bn | $207.0m | 1.60% | 4,016 | 6,382,833 |
| 6 | MetLife | $11.2bn | $412.1m | 3.69% | 9,068 | 43,025,139 |
| 7 | Anthem / Elevance | $6.3bn | $140.2m | 2.21% | 3,538 | 5,689,758 |
| 8 | Hartford | $4.7bn | $171.0m | 3.64% | 4,499 | 14,481,795 |
| 9 | Unum / Colonial Life / Provident | $4.3bn | $322.6m | 7.44% | 8,782 | 9,815,384 |
| 10 | Life Insurance Company Of North America | $4.0bn | $153.9m | 3.88% | 4,310 | 14,964,135 |
| 11 | Lincoln Financial | $3.9bn | $227.7m | 5.78% | 5,360 | 12,608,351 |
| 12 | Prudential | $3.8bn | $142.0m | 3.75% | 2,160 | 10,521,648 |
| 13 | California Physicians Service | $3.4bn | $18.3m | 0.54% | 819 | 486,586 |
| 14 | Guardian | $2.7bn | $300.2m | 11.07% | 9,410 | 4,461,533 |
| 15 | Securian | $2.2bn | $27.2m | 1.25% | 311 | 8,295,064 |
| 16 | Sun Life | $2.2bn | $148.3m | 6.85% | 4,204 | 4,260,622 |
| 17 | Voya / ReliaStar | $1.7bn | $165.0m | 9.67% | 1,628 | 6,361,392 |
| 18 | Vsp | $1.7bn | $26.5m | 1.59% | 7,500 | 10,470,374 |
| 19 | Mutual of Omaha | $1.6bn | $165.4m | 10.17% | 7,969 | 11,917,180 |
| 20 | Communitycare Hmo | $1.5bn | $646,841 | 0.04% | 66 | 22,702 |
| 21 | Delta Dental | $1.4bn | $36.3m | 2.60% | 3,235 | 3,550,804 |
| 22 | Reliance Standard | $1.3bn | $100.5m | 7.47% | 2,853 | 5,321,545 |
| 23 | Priority Health | $1.1bn | $10.5m | 0.96% | 244 | 202,381 |
| 24 | EyeMed | $1.1bn | $29.3m | 2.74% | 6,885 | 14,953,824 |
| 25 | Sierra Health And Life Insurance | $772.7m | $1.9m | 0.24% | 170 | 620,635 |
| 26 | Hawaii Dental Service | $755.2m | $5.9m | 0.78% | 473 | 600,757 |
| 27 | Principal Financial | $707.6m | $65.0m | 9.18% | 3,915 | 1,377,036 |
| 28 | Health Plan Of Nevada | $697.9m | $18.6m | 2.67% | 160 | 105,177 |
| 29 | Harvard Pilgrim Health Care | $615.3m | $7.3m | 1.19% | 200 | 71,762 |
| 30 | Continental American Insurance | $610.5m | $83.9m | 13.74% | 1,195 | 1,392,644 |
| 31 | Medica Insurance | $576.6m | $12.8m | 2.23% | 246 | 78,115 |
| 32 | Symetra | $532.9m | $47.0m | 8.81% | 1,053 | 997,756 |
| 33 | Horizon Healthcare Services | $528.9m | $13.7m | 2.59% | 231 | 96,537 |
| 34 | Selecthealth | $486.3m | $10.7m | 2.19% | 171 | 87,147 |
| 35 | Quartz Health Benefit Plans Corporation | $471.1m | $2.9m | 0.61% | 135 | 77,521 |
| 36 | Hcc Life Insurance | $452.3m | $11.2m | 2.47% | 1,023 | 509,198 |
| 37 | Hm Life Insurance | $380.3m | $4.4m | 1.17% | 863 | 351,758 |
| 38 | Rocky Mountain Hospital & Medical Service | $370.6m | $10.9m | 2.95% | 144 | 147,288 |
| 39 | Dearborn Life Insurance | $364.8m | $32.7m | 8.97% | 2,059 | 1,022,301 |
| 40 | Humana | $355.9m | $10.9m | 3.06% | 783 | 403,065 |
| 41 | Hphc Insurance | $343.9m | $3.9m | 1.14% | 116 | 43,525 |
| 42 | Sharp Health Plan | $340.2m | $2.2m | 0.64% | 53 | 57,100 |
| 43 | Group Hospitalization Medical Services | $337.3m | $986,935 | 0.29% | 115 | 53,584 |
| 44 | Providence Health Plan | $336.5m | $9.7m | 2.87% | 111 | 55,722 |
| 45 | Upmc Health Options | $333.0m | $5.9m | 1.79% | 168 | 51,170 |
| 46 | Allstate | $318.4m | $41.7m | 13.08% | 1,205 | 1,329,763 |
| 47 | First Unum Life Insurance | $311.4m | $14.8m | 4.75% | 820 | 600,430 |
| 48 | Emblemhealth | $310.0m | $5.2m | 1.68% | 112 | 234,180 |
| 49 | Healthy Alliance Life Insurance | $293.4m | $7.3m | 2.50% | 137 | 139,688 |
| 50 | Legalplans, USA | $286.2m | $4.8m | 1.68% | 764 | 510,134 |
3. Who leads each benefit
The overall table is dominated by health, because health is where the money is. Split it up by benefit and the picture changes: one insurer leads four of the six main benefits, and it is not a health insurer.
These six tables rank by people covered rather than premium, and the premium column next to them needs care. A contract that covers health, dental and vision together reports one premium, and that whole figure gets counted under all three benefits. So premium per benefit is too high wherever benefits are sold together, which is why the ranking uses people instead. It also explains rows like MetLife under health, where a lot of people sit on contracts that cost very little.
Health
| # | Insurer | People covered | Premium | Employers |
|---|---|---|---|---|
| 1 | Blue Cross Blue Shield | 7,519,214 | $20.8bn | 12,313 |
| 2 | MetLife | 5,717,348 | $645.2m | 844 |
| 3 | UnitedHealthcare | 5,626,744 | $16.8bn | 5,959 |
| 4 | Kaiser Foundation Health Plan | 5,501,953 | $32.7bn | 8,850 |
| 5 | Cigna | 2,948,076 | $11.5bn | 5,329 |
| 6 | Aetna | 2,349,304 | $11.4bn | 2,492 |
| 7 | Four Ever Life Insurance | 1,741,495 | $74.2m | 206 |
| 8 | Sutter Health Plan | 1,042,176 | $202.9m | 237 |
| 9 | Anthem / Elevance | 1,010,931 | $5.6bn | 1,717 |
| 10 | Sierra Health And Life Insurance | 718,267 | $740.7m | 166 |
Dental
| # | Insurer | People covered | Premium | Employers |
|---|---|---|---|---|
| 1 | MetLife | 12,414,291 | $3.3bn | 4,677 |
| 2 | Delta Dental | 8,742,265 | $1.4bn | 7,384 |
| 3 | Cigna | 3,845,829 | $6.8bn | 4,993 |
| 4 | Aetna | 3,198,827 | $6.8bn | 2,151 |
| 5 | Guardian | 2,975,173 | $2.0bn | 6,325 |
| 6 | Blue Cross Blue Shield | 2,769,271 | $7.0bn | 4,864 |
| 7 | UnitedHealthcare | 2,635,218 | $6.9bn | 3,229 |
| 8 | Kaiser Foundation Health Plan | 2,026,277 | $2.7bn | 2,094 |
| 9 | Principal Financial | 829,783 | $511.5m | 2,673 |
| 10 | Ameritas Life Insurance | 757,650 | $232.2m | 957 |
Vision
| # | Insurer | People covered | Premium | Employers |
|---|---|---|---|---|
| 1 | EyeMed | 21,240,426 | $1.0bn | 6,860 |
| 2 | Vsp | 13,791,959 | $1.1bn | 8,371 |
| 3 | MetLife | 11,311,234 | $1.6bn | 3,959 |
| 4 | UnitedHealthcare | 3,414,984 | $6.3bn | 3,480 |
| 5 | Kaiser Foundation Health Plan | 3,045,377 | $2.5bn | 2,419 |
| 6 | Aetna | 2,105,453 | $4.8bn | 1,481 |
| 7 | Guardian | 2,036,405 | $1.8bn | 5,646 |
| 8 | Blue Cross Blue Shield | 1,908,953 | $3.2bn | 2,998 |
| 9 | Anthem / Elevance | 1,786,408 | $3.2bn | 1,712 |
| 10 | Cigna | 1,286,147 | $3.7bn | 2,558 |
Life
| # | Insurer | People covered | Premium | Employers |
|---|---|---|---|---|
| 1 | MetLife | 28,736,918 | $7.1bn | 4,847 |
| 2 | Prudential | 12,425,938 | $3.2bn | 1,920 |
| 3 | Mutual of Omaha | 10,094,653 | $1.1bn | 7,572 |
| 4 | Hartford | 7,812,310 | $3.4bn | 3,667 |
| 5 | Securian | 7,027,031 | $2.0bn | 304 |
| 6 | Lincoln Financial | 5,829,379 | $2.1bn | 4,855 |
| 7 | Life Insurance Company Of North America | 5,608,971 | $2.3bn | 3,827 |
| 8 | Unum / Colonial Life / Provident | 5,466,565 | $2.5bn | 5,828 |
| 9 | Voya / ReliaStar | 3,781,231 | $951.7m | 680 |
| 10 | The Standard | 3,224,642 | $80.1m | 2,385 |
Short-term disability
| # | Insurer | People covered | Premium | Employers |
|---|---|---|---|---|
| 1 | MetLife | 12,497,122 | $2.5bn | 2,757 |
| 2 | Mutual of Omaha | 7,950,743 | $909.7m | 5,650 |
| 3 | Hartford | 3,704,355 | $1.9bn | 2,038 |
| 4 | Unum / Colonial Life / Provident | 3,136,694 | $1.7bn | 4,032 |
| 5 | Lincoln Financial | 2,919,724 | $1.1bn | 3,075 |
| 6 | Life Insurance Company Of North America | 2,625,340 | $1.2bn | 2,499 |
| 7 | Prudential | 2,147,896 | $1.2bn | 1,086 |
| 8 | Guardian | 2,099,822 | $1.8bn | 5,267 |
| 9 | The Standard | 1,844,987 | $38.8m | 1,395 |
| 10 | Sun Life | 1,402,155 | $1.0bn | 2,129 |
Long-term disability
| # | Insurer | People covered | Premium | Employers |
|---|---|---|---|---|
| 1 | MetLife | 14,818,175 | $3.5bn | 3,478 |
| 2 | Hartford | 8,334,705 | $3.6bn | 3,303 |
| 3 | Mutual of Omaha | 8,273,205 | $992.3m | 6,524 |
| 4 | Lincoln Financial | 6,725,626 | $2.3bn | 4,625 |
| 5 | Life Insurance Company Of North America | 5,511,885 | $2.2bn | 3,756 |
| 6 | Unum / Colonial Life / Provident | 5,366,087 | $2.8bn | 4,738 |
| 7 | Prudential | 3,870,257 | $2.0bn | 1,779 |
| 8 | Sun Life | 2,876,238 | $1.4bn | 2,565 |
| 9 | The Standard | 2,489,099 | $57.4m | 2,045 |
| 10 | Guardian | 2,468,685 | $2.1bn | 5,932 |
What the split shows
Blue Cross Blue Shield leads health and EyeMed leads vision, but MetLife leads dental, life, short-term disability and long-term disability. Employers tend to buy health from a medical insurer and everything else from a firm that specialises in the rest. That is why one overall ranking is a poor guide to who an employer actually deals with.
4. How concentrated the market is
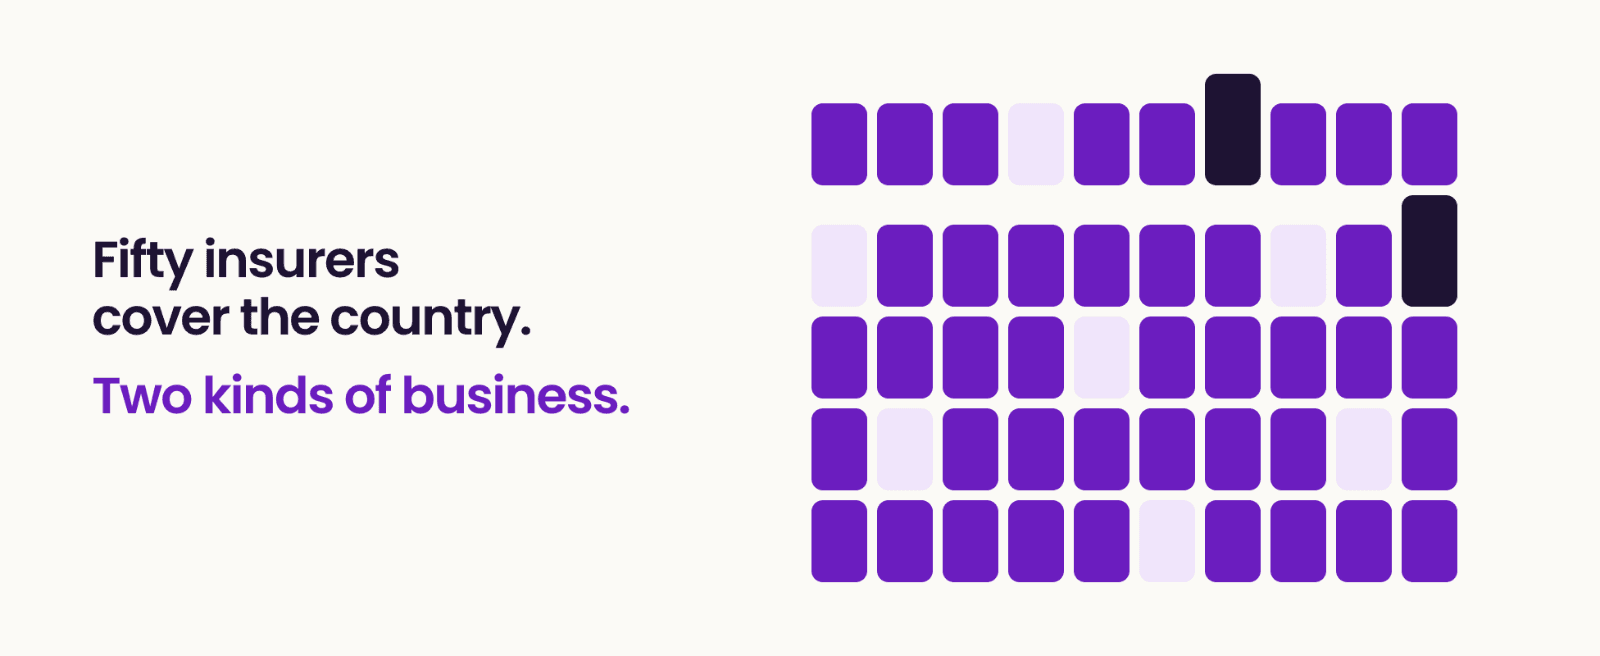
The ten biggest insurers hold $132.9bn of premium, which is 71.7% of the total. The 50 in the table above hold 94.0%. The other 770 insurers share roughly 6.0%.
The market is more concentrated than the employer counts suggest. Kaiser Foundation Health Plan leads on premium with 14,082 employers, while several insurers further down the table are named by more employers on much smaller contracts.
5. How we built this list, and what it does not show
The source is every 2024 Form 5500 filing with an insurance schedule, read from the Department of Labor's public filing system and checked against its own list of filings on 17 September 2026.
Three things matter if you plan to quote these numbers.
Self-funded benefits are missing
These filings cover benefits bought from an insurer. An employer that pays claims out of its own money reports no premium, even though a big insurer may still run the plan for it. So health insurers look smaller here than the number of plans they run would suggest, and this hits the largest employers hardest.
Insurer names are grouped by hand
Insurers appear under many different company names and spellings. We group them using a published list of spellings and the industry's own company codes. It is a careful effort, not a full record of which company owns which, so some parts of a group may sit apart from the parent.
Premium is whatever employers reported
A small number of filings carry figures that are plainly wrong, such as fees larger than the premium itself. Contracts that fail those checks are left out of the money columns. We have not corrected any reported number, only left out the ones that cannot be right.
For the firms that advise employers and place this cover, see the 100 largest employee benefits brokers. For what employers actually put in a benefits package, and where the gaps are, see what benefits big US employers offer.
Filings can still be changed, and late ones still come in, so these figures describe the record as it stood on 17 September 2026.
Fact-checked and reviewed by Kiruba Shankar Eswaran or another licensed agent on our team. Read our editorial standards.
This guide is for general educational purposes and is not insurance advice. Product features, availability, and amounts vary by state and by policy. Always review the official plan documents for the full terms, limitations, and exclusions before you buy.